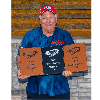
James "Jimmy" Lutz, a Carbon Express Pro-Staffer, earned a gold medal at the USA Archery Rebel Gear Buckeye Classic in Dublin, Ohio. Lutz used Carbon Express Nano Pro RZ 350 arrows and a TruFire Rivet release, securing his third podium finish at the USAT Series this year.
Construction at the Cyr Bridge Fishing Access Site boat slide begins July 27, with daytime operations continuing and temporary evening closures Monday-Thursday. Montana Fish, Wildlife & Parks will assist boaters as crews replace wood and stairs to maintain safe conditions for Alberton Gorge whitewater floaters.
Michigan DNR conservation officers Jeff Panich, Jesse Grzechowski, Alex Bourgeois, Nico Luna, and Sgt. Jon Warner rescued four people from Lake Huron near Harrisville, including two sailboat occupants and a paddle boarder and kayaker who attempted to assist. All were safely brought to shore with no injuries reported.
Team Beretta athletes achieved outstanding results at the 48th FITASC Sporting World Championship in Portugal, with Desirae Edmunds capturing Silver in the Ladies Division. Anthony Matarese Jr., Joseph Fanizzi, and Connor Daniel earned Top-10 finishes, while Fanizzi and Daniel's teams won first place in their respective divisions.
Fiocchi of America's Pro Team achieved exceptional results at the NSCA North Central Regional in Illinois and Iowa State Trap Tournament in Iowa. Bill McGuire captured three Veteran championships, Kiersten Sales earned two podium finishes, and Shelby Skaggs won eight Lady I event championships at the state competition.
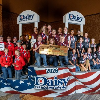
The 59th annual Daisy Nationals BB Gun and Air Rifle Championship Match held in Rogers, Arkansas showcased youth precision shooting with competitors aged 8–20. Violet Combs won the BB Gun Individual National Championship, while Walton County claimed the Team Gold Medal and Austin Crawford took the Airgun Individual National Championship, with top finishers earning scholarships and Daisy credit.
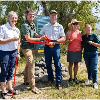
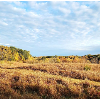
Montana Fish, Wildlife & Parks accepted an 82-acre island donation from Trust for Public Land on the upper Yellowstone River, creating Siskin Island Fishing Access Site. The acquisition protects riparian habitat, expands public access, and will be managed for conservation and recreation including float-in camping and fishing.
The U.S. Fish and Wildlife Service downlisted the razorback sucker from endangered to threatened, marking a significant conservation milestone after 30+ years of collaborative efforts by Arizona, California, Colorado, Nevada, New Mexico, Utah, federal agencies, tribes, and the Arizona Game and Fish Department.
The Indiana Conservation Partnership announced 2025 conservation accomplishments, with landowners installing over 44,800 new conservation practices and preventing 2.1 million tons of sediment from entering waterways. Hoosier farmers planted 242,000 acres of cover crops and implemented 217,000 acres of conservation tillage with ICP assistance.
Grand Slam Club/Ovis has pledged a five-year commitment to Wild Giants Conservation Fund to support rewilding efforts in the Republic of Georgia, including habitat restoration and community-led conservation. The partnership aims to restore native species like Bezoar Ibex to their historic range in the Caucasus.
The Michigan DNR acquired two significant properties in Q2 2026: the 40-acre Bavin Tract in Hillsdale County for Lost Nation State Game Area, and the 320-acre Thunder Bay River Headwaters Tract in Montmorency County for Atlanta Forest Management Unit. Ess Lake Development Corporation contributed $231,000 toward the Thunder Bay acquisition.
The Second Amendment Foundation filed an amicus brief in Maryland's Supreme Court supporting Darius Duvall's petition challenging the state's refusal to recognize out-of-state carry permits. The brief, joined by Maryland Shall Issue, National Rifle Association, California Rifle & Pistol Association, Minnesota Gun Owners Caucus, Second Amendment Law Center, Citizens Committee for the Right to Keep and Bear Arms, and Cato Institute, argues Maryland's policy violates the Second Amendment and lacks historical precedent.
RCBS and Hodgdon Powder Company will host four reloading seminars at the 2026 US National Matches at Camp Perry, Ohio, from July 25-31. Sessions range from introductory-to-intermediate for team support personnel to advanced workshops for experienced handloaders, featuring expert staff, door prizes, and exclusive product offers.
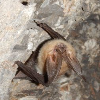
The Utah Division of Wildlife Resources is hosting a bat viewing event on August 7 in Nine Mile Canyon near Wellington. Attendees will observe biologists conducting netting surveys and see bats up close before release, with DWR Southeastern Region Outreach Manager Brandon Behling emphasizing the ecological importance of Utah's 18 bat species.
Silencer Central's 100 Days of Silence promotion concludes with a grand finale prize package worth over $12,000, including a BANISH 30 Gold-V2 suppressor, Wilson Combat Silent Bandit, Auto-Ordnance M1 Carbine SBR, and tactical training. Entries open July 24-25 at PopularSuppressors.com.
The Discover the Outdoors Field Trip Grant Program, administered by the Indiana Natural Resources Foundation, will distribute $30,154 through 72 grants to K-12 schools for field trips to Indiana State Parks. An estimated 5,019 students will benefit from grants of up to $500 for transportation, program fees, and classroom supplies.
Montana Fish, Wildlife & Parks offers Hunter and Bowhunter Education classroom courses and field days in southeast Montana, including locations in Sidney, Wibaux, Richey, Ekalaka, and Miles City. Registration is available through fwp.mt.gov, with courses scheduled throughout the year based on volunteer availability.
The Arizona Game and Fish Department has released proposed recommendations for 2027 spring and fall turkey and bison seasons for public review. Comments can be submitted via email to AZHuntGuidelines@azgfd.gov or by contacting regional offices. The Arizona Game and Fish Commission may consider the recommendations at a public meeting on August 7 in Williams, Arizona.
Retrieving Freedom, Inc. mourns the passing of Robert D. "Bob" Hayden, a longtime benefactor who, along with his late wife Barbara, donated their WoodDale Farm property in Sedalia, Missouri, enabling the organization to train service dogs for veterans with disabilities and children with autism. Hayden's legacy includes his leadership of Sierra Bullets and co-founding of Starline Brass.
KDG, headquartered in Seymour, Connecticut, has completed its brand transition and is accelerating product development with a focus on innovation and American manufacturing. The company plans to expand its Kinect and SideLok product lines while introducing new categories, with all products designed and manufactured in the United States.
Federal Ammunition is now shipping a new 45 Colt, 235-grain jacketed hollow-point load for its Power-Shok handgun line. According to Chris Laack, Handgun Product Manager at Federal, the load is suited for medium and big game including hogs and deer, and also performs well from lever-action rifles.
The International Hunter Education Association – United States of America (IHEA-USA) has partnered with NSSF's First Shots program to integrate shooting safety education into hunter education courses across all 50 states. Eleven states currently participate, with Maine introducing over 400 new shooters in three months.
Knife Rights, founded in 2006 by the author in response to a Wall Street Journal article, celebrates two decades of advancing knife owners' civil rights. The organization has achieved 58 legislative victories and court wins repealing knife bans across 36 states, federal law, and over 200 cities, while defeating 13 anti-knife bills and litigating federal Second Amendment challenges.
Safari Club International (SCI) is offering complimentary one-year memberships to Professional Outdoor Media Association (POMA) members. The partnership invites outdoor communicators and journalists to join SCI's global community dedicated to protecting hunting freedoms, advancing science-based wildlife conservation, and preserving hunting heritage.
Gun Owners of America has appointed Quinn Cassidy as Managing Director of Advancement to build strategic corporate partnerships and cultivate major donors. Cassidy brings nearly a decade of industry experience, including his recent role as Manager of Exhibition and Sponsorships for the SHOT Show at the National Shooting Sports Foundation.
Walk the Talk America announced its four most-downloaded Guns & Mental Health podcast episodes from early 2026, featuring conversations with Charles Anderson of Athlon Outdoors, Yale researcher Kerri Raissian, Sandy Hook mother Nelba Márquez-Greene, and Dr. Chris Knoepke on mental health and responsible firearm ownership.
Tac Shield introduces the Bird Dog Shotgun Sling, a hardware-free carry strap designed for upland hunters and bird dog handlers. The sling features slip-over cinch loops, suede-lined barrel protection, and padded Tac-Grip material, allowing comfortable field carry without permanently modifying firearms.
Avian-X has expanded its Power Butt Kicker motion decoy lineup with three new species: Mallard Hen, Pintail Drake, and Black Duck. These decoys feature anatomically accurate bodies with power-kicking webbed feet that replicate natural feeding behavior, available now online and in-store with dual motion modes for extended runtime.
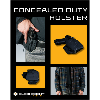
BlackPoint Tactical, a High Speed Gear Products Group brand, launches the Concealed Duty Holster (CDH), an active-retention holster combining duty-level security with concealed carry concealability. Initially available for Glock 17 and 19/45 with TLR-7 and TLR-7 HLX, the KYDEX holster features Level II retention and is designed and manufactured in the USA.
Custom & Collectable Firearms unveiled the limited-edition Heckler & Koch Mark 23 Bellum .45 ACP, featuring custom diamond-pattern engraving, OD Green and FDE Cerakote finishes, Aimpoint ACRO red-dot sight, and SilencerCo Osprey suppressor. Only 50 individually numbered packages are available.
The Tennessee Wildlife Resources Foundation, Inc. (TWRF) is promoting its 2026 Wildlife Conservation Raffle featuring 15 premium prize packages totaling over $200,000, including a Caymas CX 19 Pro boat, $50,000 Ford vehicle voucher, and guided hunting experiences. Supported by Academy Sports + Outdoors, Bass Pro Shops, Caymas Boats, Ford, Muddy, and Parker's Outfitters, ticket sales continue through November 8, 2026, with drawings scheduled for November 10, 2026.
Apex Ammunition will exhibit at the 2026 Ducks Unlimited Expo in Memphis, TN (July 31-August 2) showcasing its Waterfowl Stratified S3 Steel, TSS, and TSS/S3 Steel Blend loads. The company will also launch a new waterfowl line with 24.7 Hunt, with both teams meeting attendees at Booth #1209 on Saturday.
Chiappa USA, the exclusive U.S. importer and distributor for Chiappa Firearms and Charles Daly, will exhibit at the Chattanooga Shooting Tradeshow 2026 on July 27–28 at the Chattanooga Convention Center. The company will showcase its complete firearms portfolio and discuss dealer programs with industry professionals.
Benelli USA will exhibit at the 2026 Delta Waterfowl Duck Hunters Expo in Des Moines, Iowa, July 24–26, showcasing the Super Black Eagle 3 Advanced Impact®, Ethos Advanced Impact®, and upgraded M2 Field lineup. The Advanced Impact barrel system delivers higher pellet density, increased velocity, and improved penetration for enhanced waterfowl hunting performance.
Franchi will showcase its new 2026 Affinity Series shotguns at the Delta Waterfowl Duck Hunters Expo, July 24–26, in Des Moines, Iowa. The 15 new models feature the next-generation Inertia Driven® platform with refined ergonomics and field-focused upgrades designed for waterfowl hunters.
AirForce Airguns and Rapid Air Worx return as sponsors for the 2026 Pyramyd Air Cup, taking place August 5–8, 2026, in Marengo, Ohio. The event features elite competitions, educational seminars, and a demo range where attendees can test-fire the latest AirForce and RAW rifles.
Hodgdon Powder Company donated Pyrodex muzzleloading propellant to the 2026 Scouting America National Jamboree, enabling thousands of Scouts to safely experience muzzleloader shooting using Traditions muzzleloaders at the July 22-31 event in West Virginia.
HEVI Ammunition announced Wade Shoemaker, an outdoor media personality and professional lifestyle photographer, as its brand ambassador and community manager. The signing was revealed at the 2026 Delta Waterfowl Duck Hunters Expo in Des Moines, Iowa, where Shoemaker will engage hunters and promote HEVI's waterfowl and hunting ammunition products.
Missouri Headwaters State Park hosts a Junior Ranger Program on reptiles, Lewis & Clark Headwaters Arrival Breakfast featuring guest speaker John Phillips, and a volunteer weed pull. Madison Buffalo Jump State Park will hold a Kite Festival with Native American art vendors, flint knapping demonstrations, Vintage Nana's Indian Tacos, and a bison program by Billy Maxwell.
Major League Fishing's Tackle Warehouse Pro Circuit Stop 6 streams live on MLFNOW! via MyOutdoorTV from Lake Champlain, featuring up to 150 pro anglers competing for a top prize of $135,000. The three-day tournament (July 24-26) is hosted by the City of Plattsburgh and Adirondack Coast Visitors Bureau, with broadcast coverage by Chad McKee and Rob Newell.
Pursuit Channel announced the addition of The Luke Branquinho Show to its programming lineup, hosted by world-champion team roper and rodeo icon Luke Branquinho. The series blends rodeo life with hunting, fishing, ranching, and Western lifestyle adventures, airing Q3 & Q4 2026 across DIRECTV, Comcast Xfinity, Verizon Fios, and Pursuit UP streaming platforms.
FWP spring mule deer surveys indicate favorable fawn recruitment across Montana, with Brian Wakeling noting the population is trending upward. While northeastern and southeastern Montana show strong recruitment and population increases, north-central and south-central regions remain below long-term averages despite recent favorable conditions.
If you're a fan of The West Wing, you're probably familiar with Season 4, Episode 6.
In ‘Game On’ President Jed Bartlet (D) faces off with Governor Robert Ritchie (R-FL) in a Presidential Debate. The opening debate question concerns states' rights and the role of the federal government. Ritchie argues states should decide where to spend their tax dollars without dictates from Washington.
Bartlet’s response eviscerates Ritchie, setting the tone for the entire debate and foreshadowing Bartlet’s win. It’s one of the many brilliant scenes fans of the The West Wing point to when explaining its popularity.
Although the scene contrasts liberal and conservative views of government—and is written from the perspective of a liberal president—it echoes today's state-level battles over firearms and conservation.
In simple terms, the PEACE Act—currently a ballot initiative—“would effectively criminalize hunting, fishing, ranching, pet breeding, rodent traps, and even putting down a mortally injured animal.”
Numerous bans on firearms—which are falling one-by-one thanks to the work of the Four Horsemen of Gun Rights (Second Amendment Foundation (SAF), National Rifle Association (NRA), Firearms Policy Coalition (FPC), and Gun Owners of America (GOA))—have taken legally made and sold modern sporting rifles and handguns off the market in some states.
In each of these cases, state legislatures, backed by anti-gun political organizations and financial donors, have been working in direct opposition to federal law, and more specifically the Constitution of the United States.
They have determined states’ rights supersede federal law, especially when it comes to an issue they just don’t like. Guns and hunting fall squarely into the Jeopardy category, “Things Liberal Legislators Hate.”
The conundrum facing liberal state legislatures is what to do with all those Pittman-Robertson funds they receive from the sale of the very products and activities they despise. These funds are distributed to state fish and wildlife agencies under the 1937 Wildlife Restoration Act and pay for wildlife conservation, hunter education, and public target ranges.
Where do those funds come from? P-R funds, for short, come from the sale of long guns, ammunition, and archery equipment (11% excise tax) and handguns (10% excise tax). These taxes are paid by the manufacturers and are based on the first sale price—usually to distributors but not always.
While you as the consumer don’t see this tax, the cost is built into the price you pay. So in the end, you are the one paying the tax because if you don’t buy ammo, guns, and archery equipment, dealers won’t carry it, and distributors won’t order it.
When that happens, manufacturers stop making it, or at least cut back on the quantity they do make. And that means the revenue generated under Pittman-Robertson declines.
Which brings us back to The West Wing. When states prohibit hunting or ban the sale of firearms and ammunition while continuing to accept conservation dollars generated by those same activities, it's reasonable for those who ultimately fund Pittman-Robertson—the 11 Percenters—to ask, as Jed Bartlet did, "Can we have it back?”
– Paul Erhardt, Managing Editor, the Outdoor Wire Digital Network